Track and manage your electricity use online

Use your MyHydro account to understand your usage
In the dark about your electricity use? Keeping an eye on your consumption with your online MyHydro account allows you to spot patterns and identify ways to save.
Log in to your account regularly to track and understand your electricity use – right down to the hour. The data comparison tools also allow you to discover how your household’s electricity habits have changed over time, with the seasons, and in comparison to your neighbours.
Ready to up your knowledge, and lower your bill? Let’s walk through the tools available within your MyHydro account, and what you should be looking for as you dig into your data.

Three ways to track your usage:
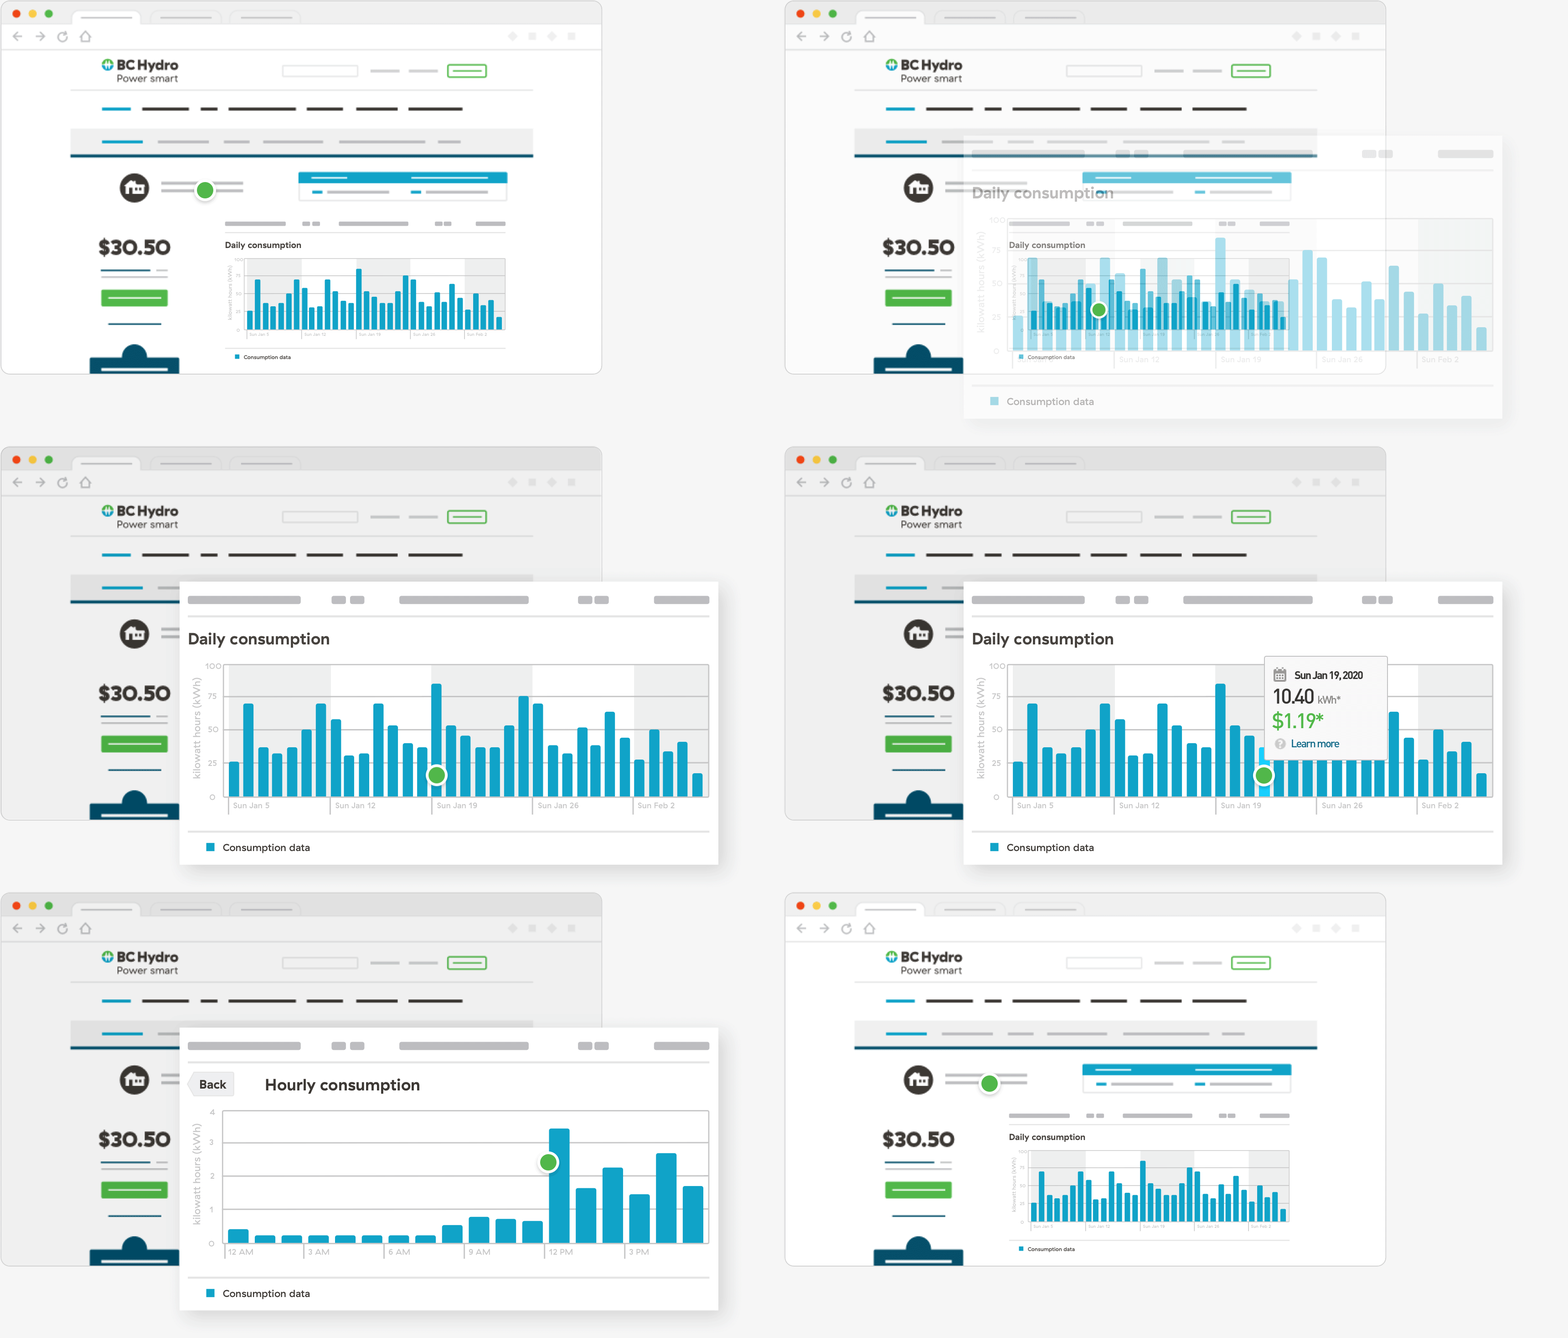
Your hourly data is your best look at how your usage fluctuates based on what you're doing throughout the day. Click the blue bars in your consumption graph to reveal this level of detail up to the previous day.
If you're on a time-of-day rate plan, refer to our time-of-day MyHydro tips instead.
What to look for:
- Look for spikes (the highest bars) and think about what activities you were doing during those highest energy-consuming hours, like running the dryer or cooking in the oven.
- Take a look at your overnight usage (typically the lowest bars). This represents your “always on” systems, like your fridge and thermostat, and idle electronics, like your PVR. See if there’s any efficiency to gain overnight.
Your daily data over the past few weeks is a great way to understand how your consumption shifts with your weekly schedule.
What to look for:
- Is there a pattern of lower usage on weekdays and higher on weekends? This typically results from leaving home for school or work on weekdays, and being home more on weekends.
- Depending on your lifestyle, the weekday versus weekend difference may not be so noticeable. For example, if you work or study from home, or tackle activities that use a lot of electricity during the week, like laundry or meal prep.
See how your usage compares week over week through the month.
What to look for:
- Keep an eye on the projected cost of your electricity use at the end of the billing period.
- If you want to take action to lower that projection before your next bill, explore our energy-saving tips and technologies.
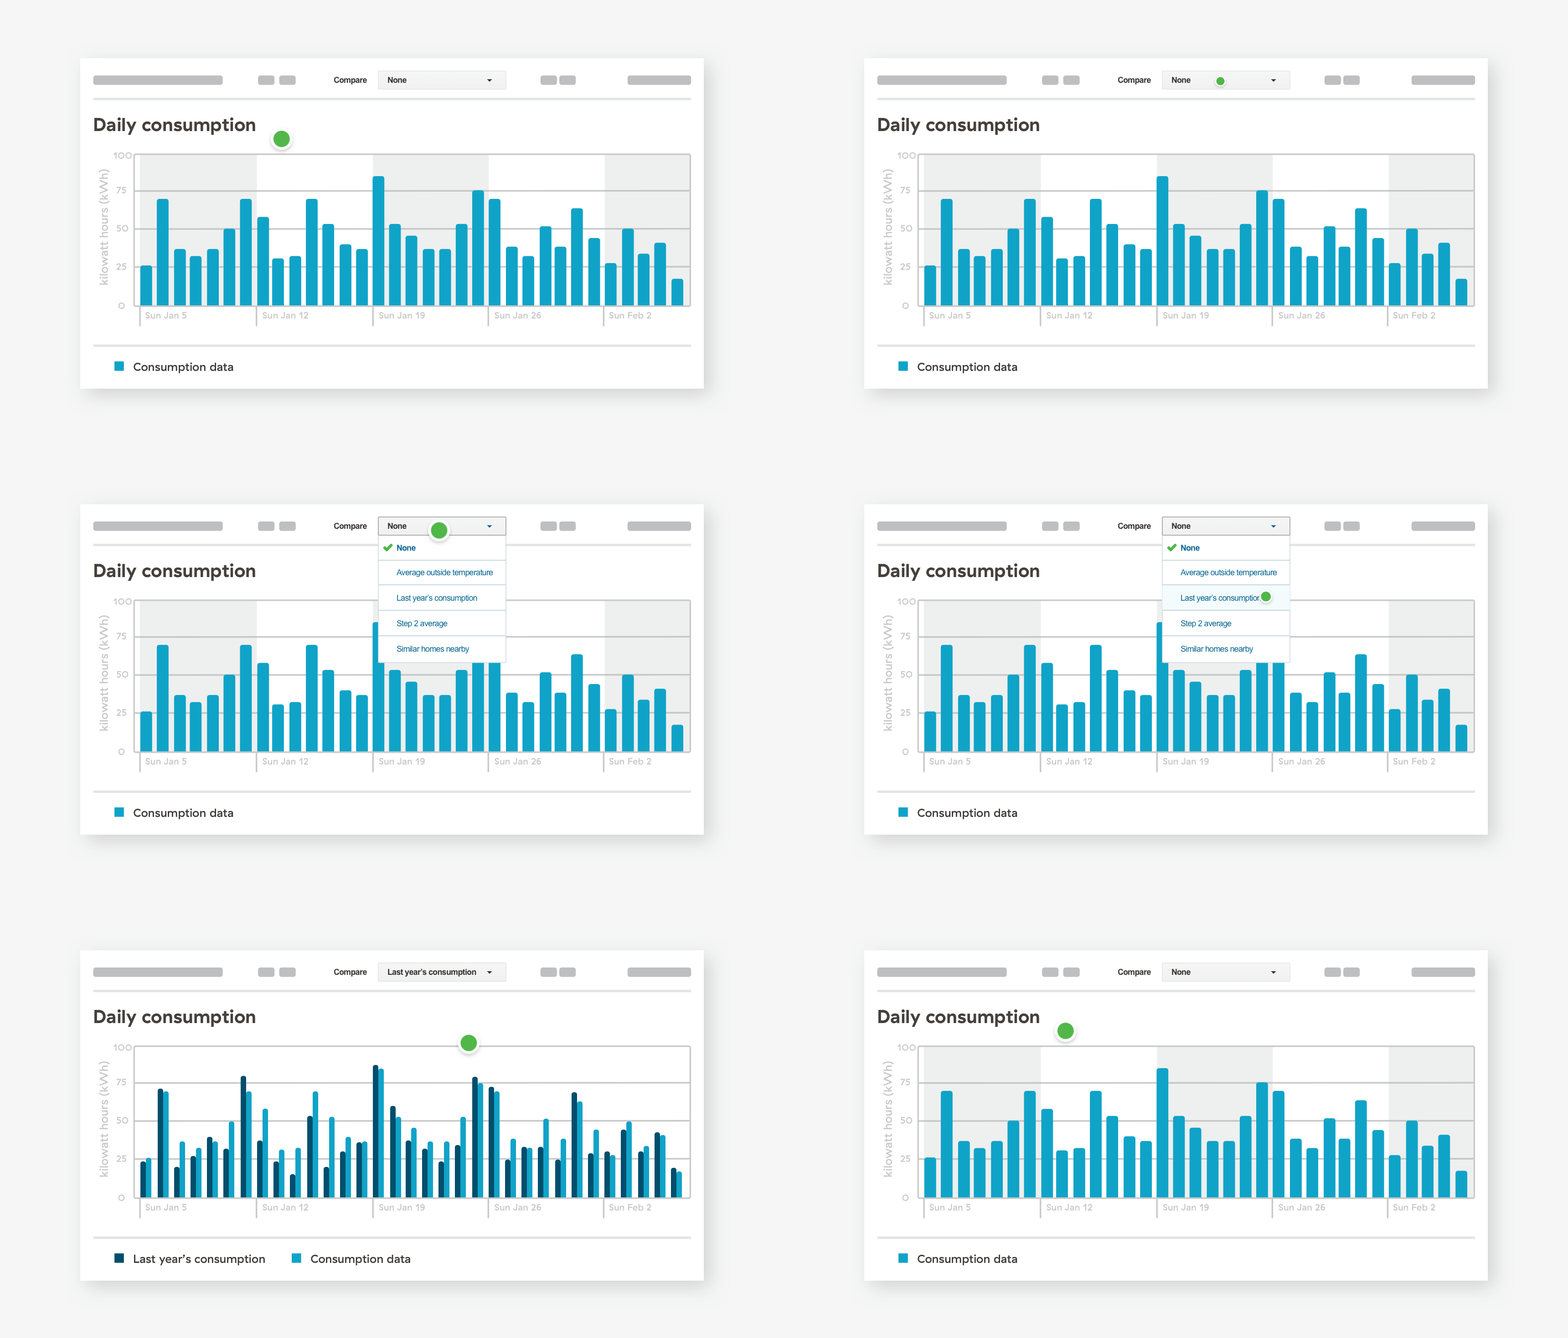
The comparison tools available in your MyHydro account provide you with more context and a better understanding for how you're using electricity.

Three ways to compare your electricity use:
See how the average outdoor temperature influences your usage. Cold snaps in winter and heat waves in summer are the biggest contributors to increased usage, if you use electric systems to heat or cool. Apply this comparison and look at how the blue bars of your usage change in relation to the temperature line.
Look at your electricity use compared to the same period last year to see how it’s changed. The average outdoor temperature can be a significant factor here, as well as things like house guests, renovations or lifestyle changes.
See how you stack up next to other homes in your area. Your comparison is based on the average electricity use of at least 30 similar homes nearby.
Set up email alerts in MyHydro
We have two types of alerts you can opt-in to:
- Tier 2 alert: we'll send you an email when your electricity use is halfway to reaching Tier 2, and another email after you’ve reached it.
- Log-in reminder: Set up a weekly or monthly reminder email to log in to check your electricity use to see how you’re tracking.
Dive deeper into your electricity use
Want to expand your learning beyond the consumption graphs?
- Use our cost calculator to understand the typical cost of running the individual appliances, lighting and electronics in your home.
- Download our free HydroHome app. It provides a high-level breakdown of what’s using energy in your home and, if you upgrade to add a hub, you’ll see real-time and device-specific energy data.
- To investigate your home’s usage at a circuit level, conduct a breaker test. This process involves monitoring your smart meter while activating individual breakers, and can help you find sources of high usage, energy waste, or other issues
Get energy saving tips and updates
Sign up to receive our monthly Connected e-newsletter and be the first to hear about new rebates and offers, contests, energy saving tips, and more straight your inbox.